Tulsa
City of Tulsa
The purpose of the Safe Streets and Roads for All program is to, “provide grants to local, regional, and Tribal communities for implementation, planning, and demonstration activities as part of a systematic approach to prevent deaths and serious injuries on the nation’s roadways.”
The City of Tulsa plans to incorporate the following safety measures:
-
Battery Backup Retrofits
-
Flashing Yellow Arrow
-
New Accessible Pedestrian Signals (APS)
-
Protected Left Turn Movement
-
Striping
-
Existing APS Upgrades
-
New Traffic Signals
For additional information about the incorporated safety measures please visit Roadway Safety Countermeasures
Roadway Safety Countermeasure Input Map
This map was made for users to leave a comment or suggest a countermeasure for a specific location. For example, if you think that additional countermeasures would be helpful, please use the comment tool to place the orange dot and add a comment in that location. In addition, you can leave a general information comment or a specific concern about safety at that location.
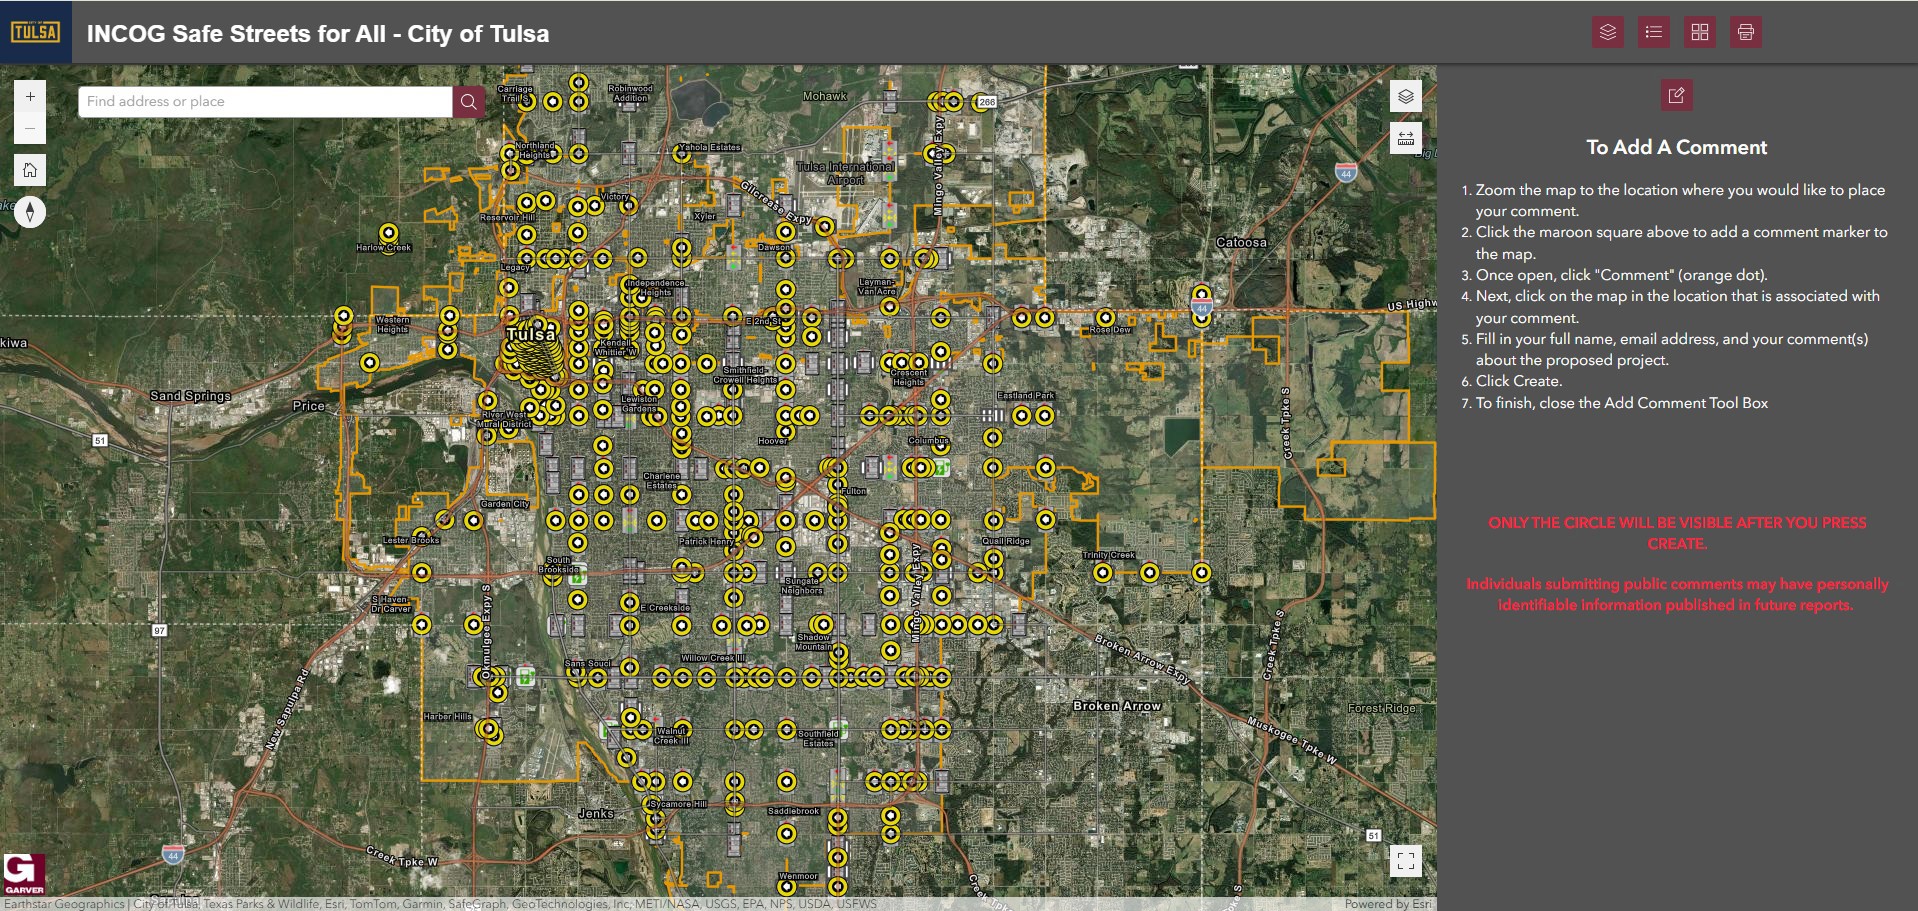
Click on the Picture Above to Access the Interactive Map 🔗
Use the map tools to enhance your viewing.
Type an address to find a specific location
Use the map legend
Add a comment to the map
Change the layers that are displayed
Return to the default view
Reset map orientation
Change the map background
Print the map
Measure distances on the map
View map full screen
-
+/- to zoom in and out
Use the map legend to enhance your viewing.
Battery Backup Retrofits
Flashing Yellow Arrow
New APS
Protected Left-Turn Movement
Striping
 Existing APS Upgrade
 New Traffic Signals
Crash Heat Maps
A crash heat map is a visual representation of traffic crash data where values are represented by different colors. Each map is unique and based on the specific collection of data being shown. Reds and oranges typically indicate a higher number of crashes at a specific location, and blues and greens represent lower number of crashes at a specific location. The colors will represent different crash totals on each individual map. Traffic crash data is from the Oklahoma Department of Transportation (ODOT).
The three crash heat maps shown below can be viewed by clicking each map image.
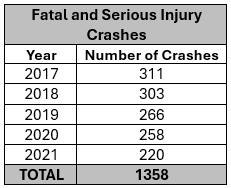
Fatal and Serious Injury Crashes
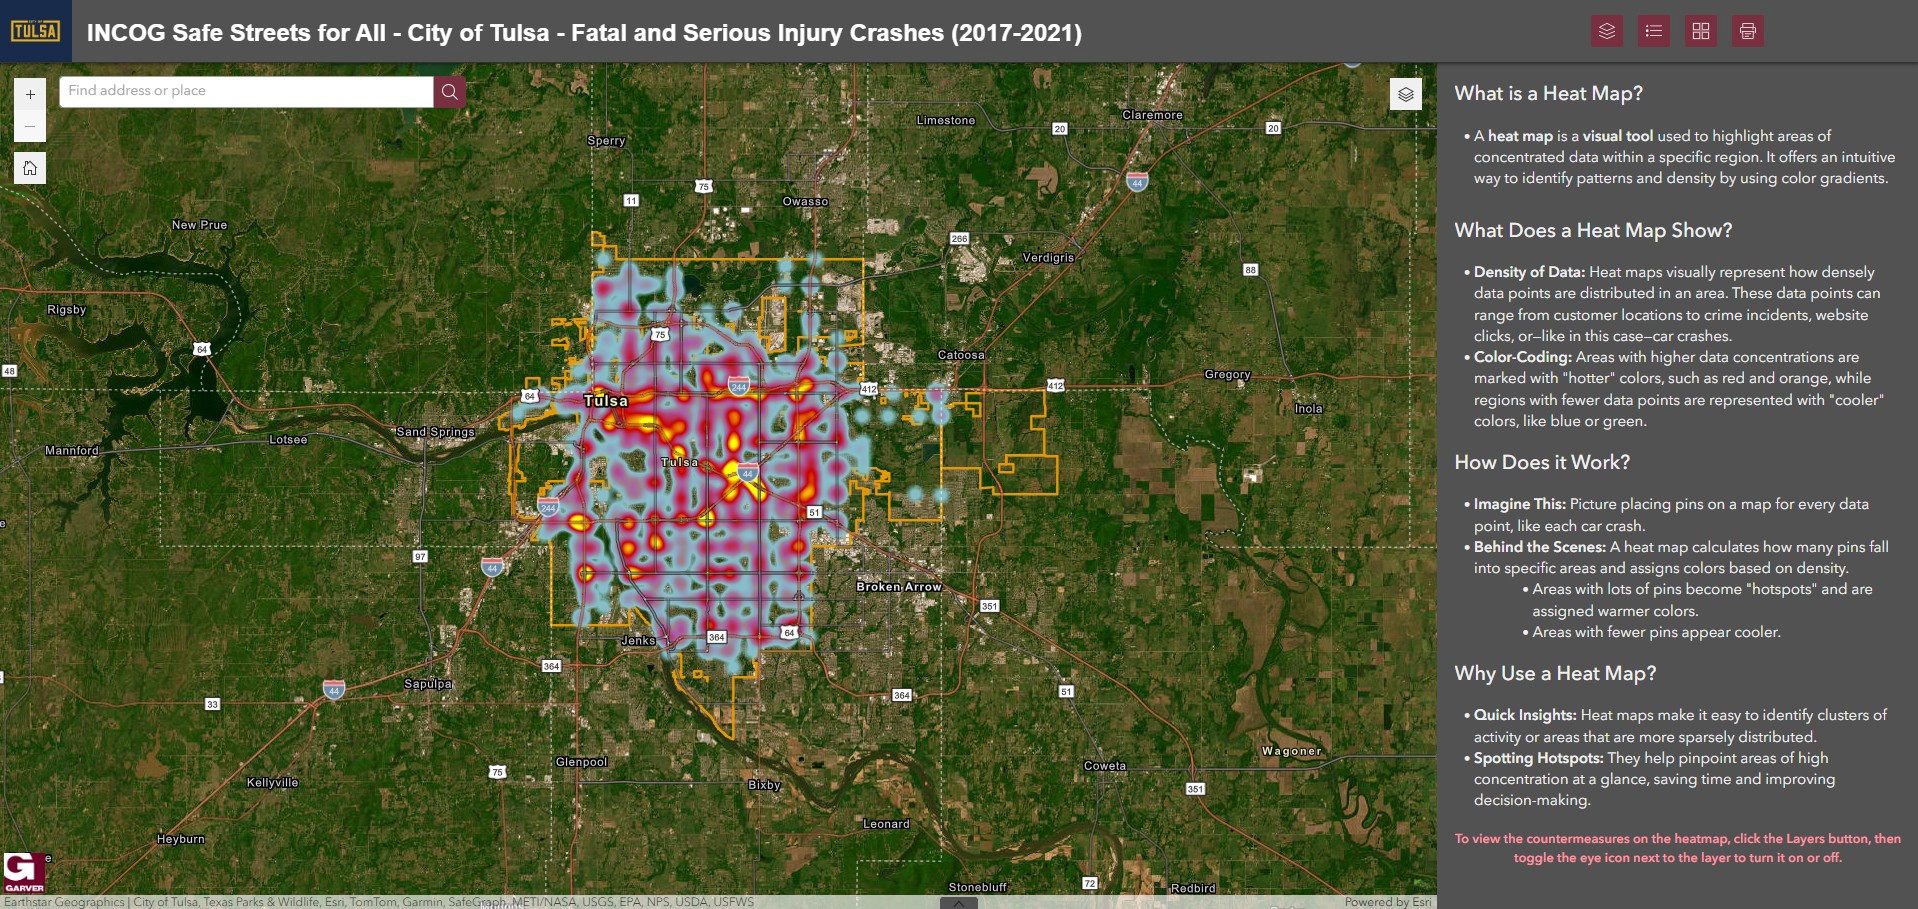
Click on the Picture Above to Access the Crash Heat Maps🔗
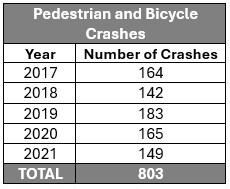
Pedestrian and Bicycle Crashes
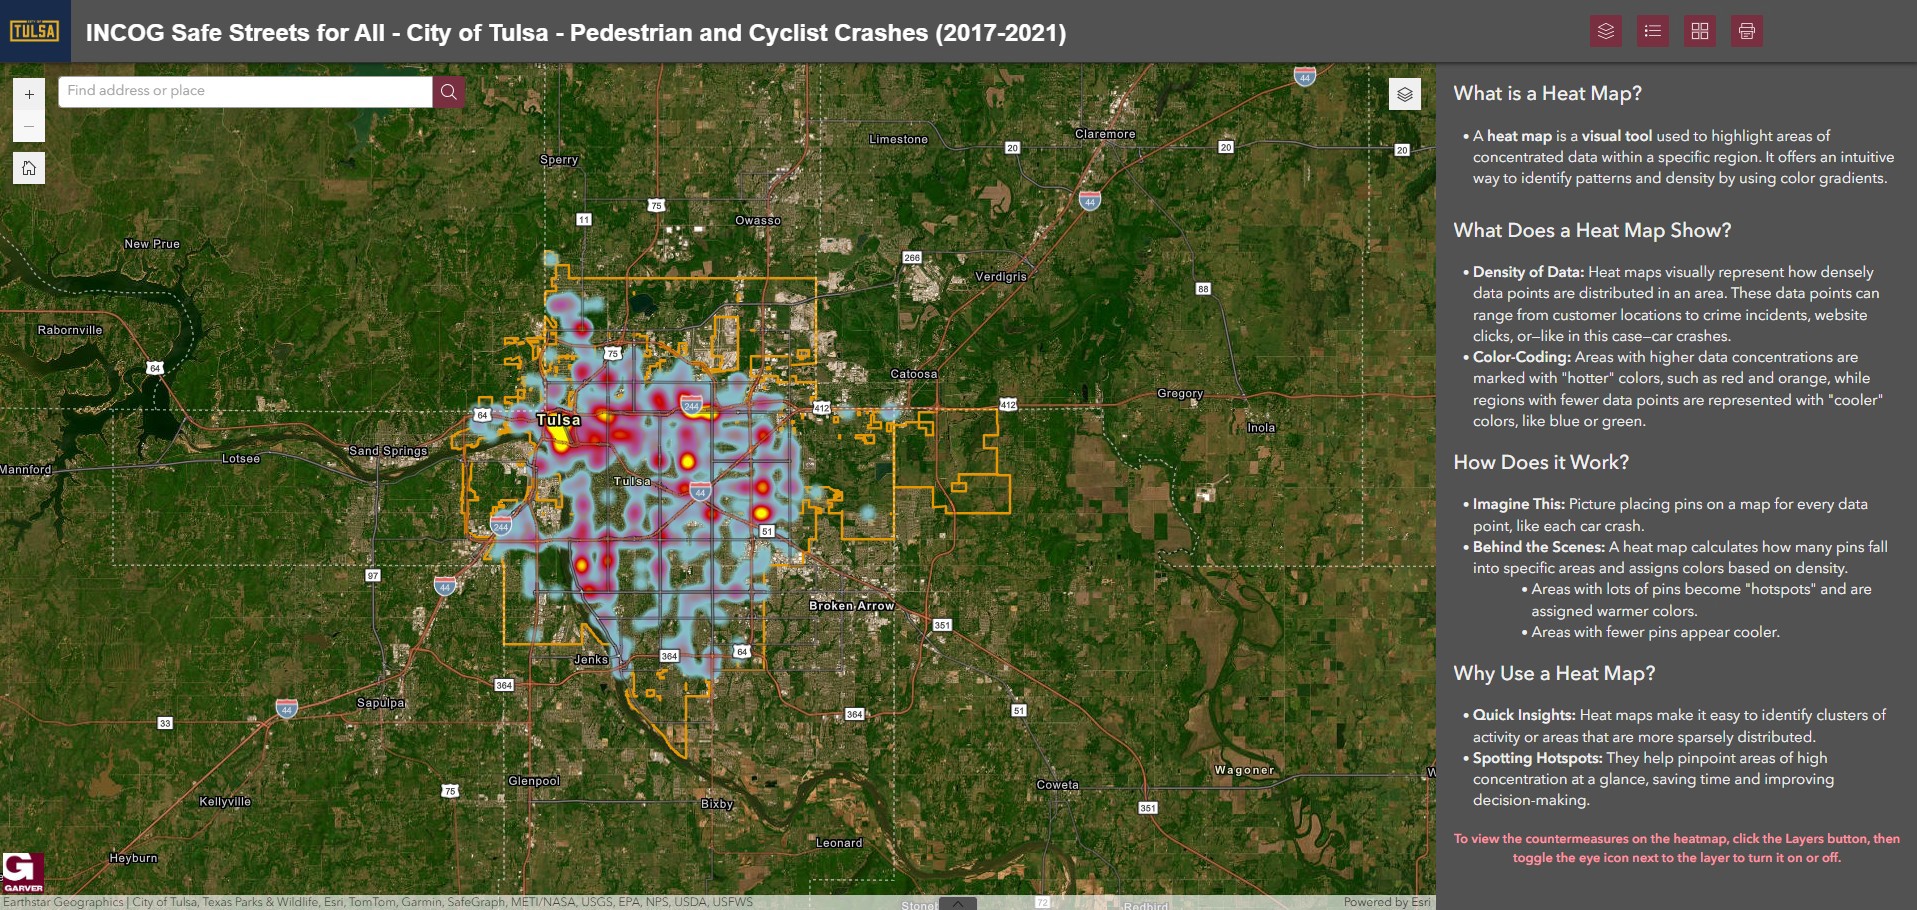
Click on the Picture Above to Access the Crash Heat Maps🔗
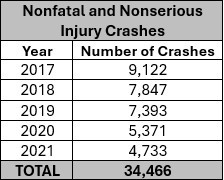
Nonfatal and Nonserious Injury Crashes
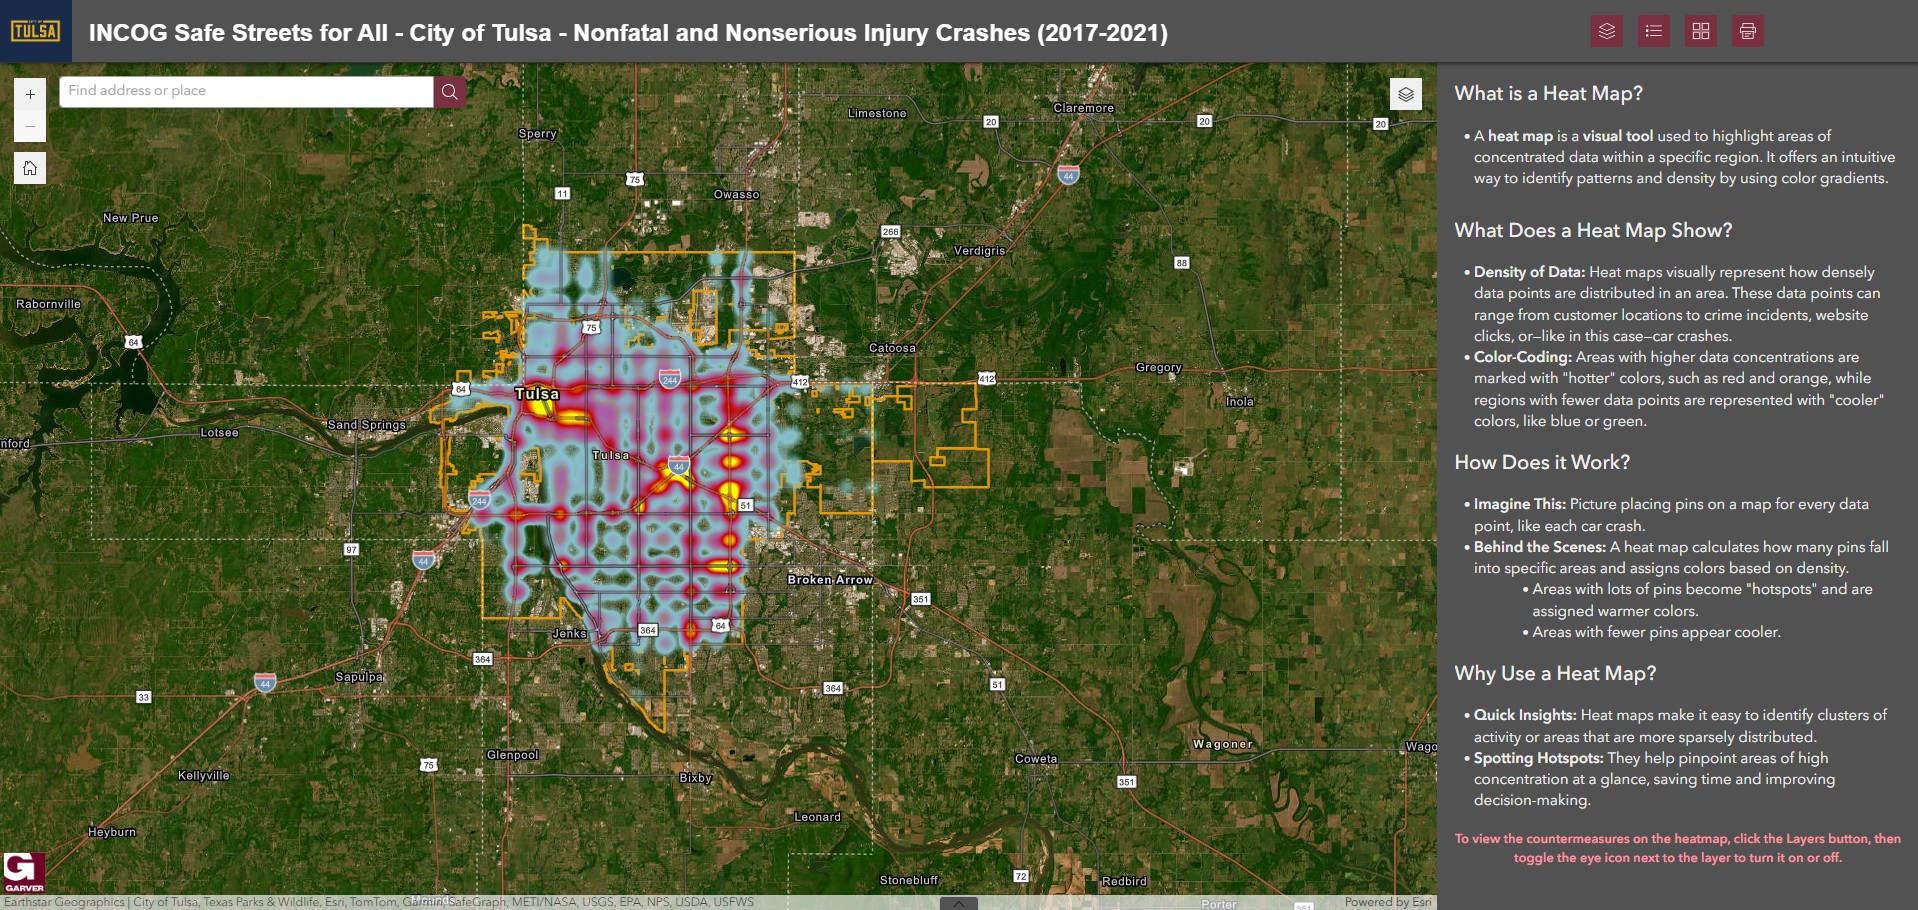
Click on the Picture Above to Access the Crash Heat Maps🔗
Below are tables that show the years in which the crashes occurred as well as the number of crashes represented in the heat maps. 2021 is the most recent crash data year available.
Comment Form
Thank you for participating and providing feedback on the City of Tulsa's proposed safety measures. Comments can be submitted directly on the interactive map above or by clicking the icon to the right and accessing the comment form.
![]()
🔗